QC Dashboard
The Quality Check (QC) Dashboard is a powerful analytical tool within our product that offers an overall view of TruCap+ document processing, focusing on auto-extraction accuracy both at the document and field level. This comprehensive documentation provides step-by-step guidance on how to utilize the QC Dashboard effectively for quality monitoring and document handling insights.
Key Features of the Quality Check (QC) Dashboard
The QC Dashboard encompasses the following key features:
Auto-Extraction Accuracy: Users can assess the accuracy of auto-extraction performed by TruCap+ for each document processed.
Document and Field-Level Insights: The dashboard offers insights not only at the document level but also at the granular field level, providing detailed performance metrics.
Processed Document Tracking: Users can track the number of processed documents, facilitating effective quality and quantity monitoring.
Accessing QC Dashboard
To access the QC Dashboard page, follow these steps:
-
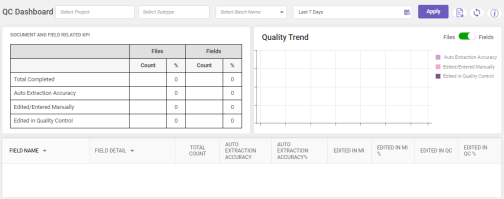
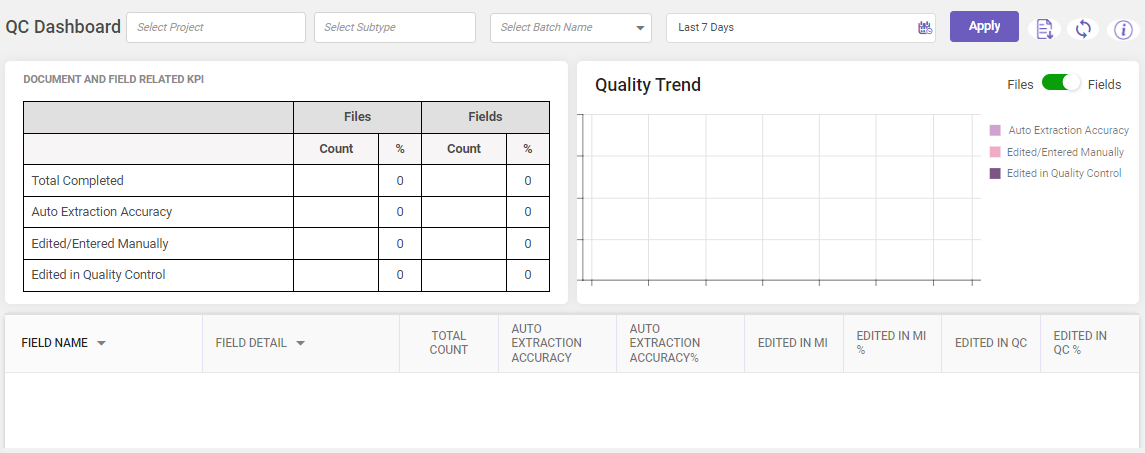
In the main menu, under Document Monitoring, click Quality Dashboard. The QC Dashboard page opens.
-
Select the required project, subtype, (or multiple projects and subtypes ) and batch name from the drop-down to view the records for a pre-defined duration or use the
 icon to specify the required duration and then click Apply.
Note:
-
It is mandatory to select Project to display the records.
-
If you do not see any information related to the selected options, please ensure that the output source for the chosen Project has been set up and is not disabled. If it hasn't been created, please create one. If it's disabled, please enable it.
All records matching the given criteria are displayed on the QC dashboard page.
-
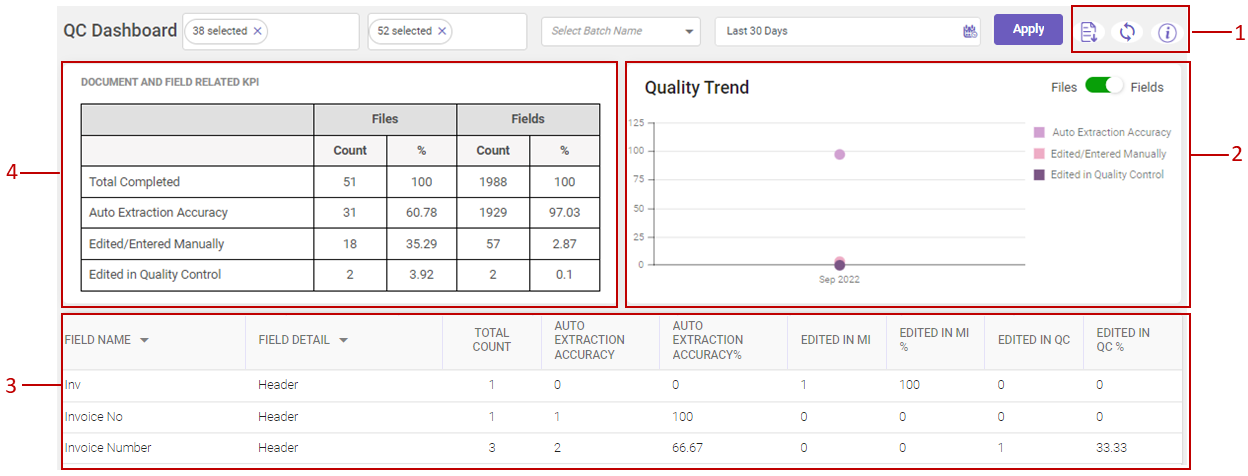
Refer the table below to read the callout descriptions.
|
# |
DESCRIPTION |
|---|---|
|
1 |
Export: Click Run QC Service: Click Column Description: Click |
|
2 |
Quality Trend — This section displays a graphical representation of document-related information extracted, manually modified, and edited during quality control. Click the |
|
3 |
This section displays the following information:
Note
|
|
4 |
Document and Field Related KPI— This section displays the total number of files and fields that are processed and the percentage of the edits made. |
 to download the data related to Document and Field Related KPI and Quality Trend in .XLSX and .PDF format respectively.
 icon to run the quality check service to observe any updates on the dashboard. Click Yes if you want to run the QC service.
 to view the column descriptions
 toggle button to see the extracted and edited data based on files or fields.